ADS 2026 Performance Highlights

ADS continues to measure and share performance across a range of sustainability and climate measures. In Fiscal 2026, those highlights include:
47.7%
of pipe revenue derived from recycled products
388 million
pounds of recycled materials process
$13.1 million
investment in capital projects to mitigate risk across our manufacturing network
22% decrease
in total recordable injury rate
285K hours
of training provided to our workforce

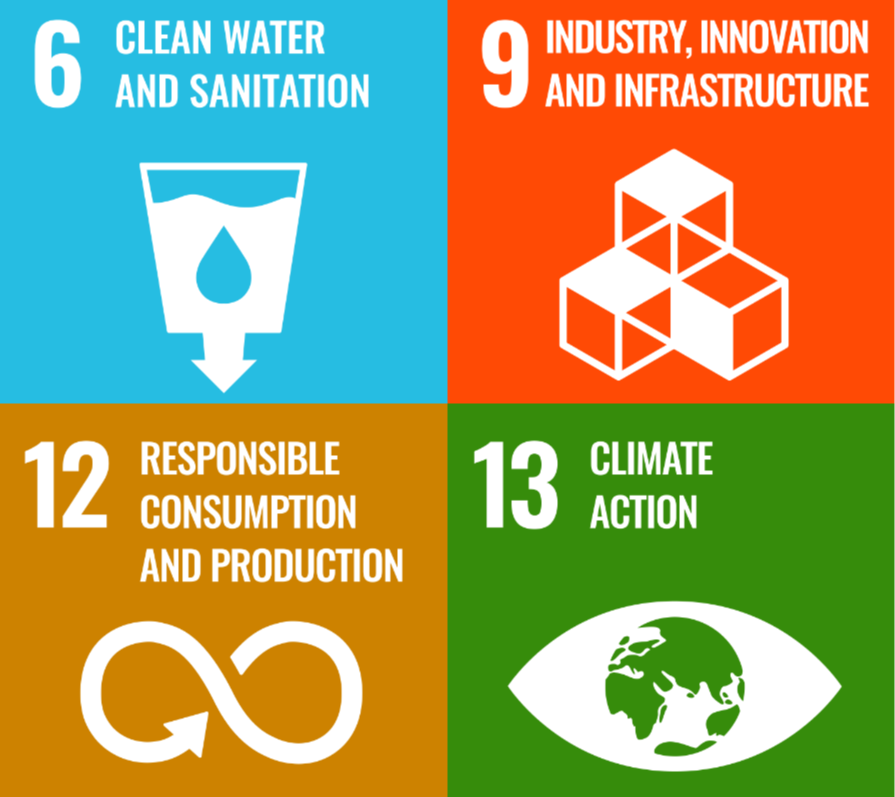
Aligning with the United Nations Sustainable Development Goals

As a signatory to the UN Global Compact, we believe it is important for ADS to identify how we can align our operations and impact with the United Nations Sustainable Development Goals (“UN SDGs”), a comprehensive framework created to enable a more sustainable world by 2030. Identifying our alignment with the UN SDGs underscores how we are demonstrating our commitment to be a conscientious corporate citizen and connecting the success of our business with positive impact for communities globally.

We are highlighting here the SDGs for which our business has the greatest impact.

UN-goals-photo-block

Fiscal Year 2026 Performance Indicators

GHG Emissions5  
Scope 1 Emissions (Metric Tons CO2e)Fiscal 20226
Fiscal 20236Fiscal 20247Fiscal 2025Fiscal 2026
Scope 1 GHG Emissions by Type     
Fuel
157,884144,296134,863
155,374150,604
Natural Gas6,5296,4245,5476,2547,108
Total Scope 1 GHG Emissions164,413150,720140,410161,628157,712*
Scope 2 Emissions (Metric Tons CO2e)Fiscal 2022
Fiscal 2023Fiscal 2024Fiscal 2025Fiscal 2026
Total Scope 2 GHG Emissions (Market Based)174,543164,855157,312146,975138,998*
Total Scope 2 GHG Emissions (Location Based)167,434 161,303154,719141,687135,320*
Emissions Intensity (Scope 1 & 2) Fiscal 2022Fiscal 2023Fiscal 2024Fiscal 2025Fiscal 2026
Total GHG Emissions (Scope 1 & 2) (Market Based) 388,956315,574297,722308,603296,710*
Total GHG Emissions (Scope 1 & 2) (Location Based) 331,847312,023295,130303,315293,033*
Total Sales ($, in millions) 2,7693,0712,8742,9043,050
Total GHG Emissions Intensity (Scope 1 & 2) (Market Based/Location Based)110 / 108103 / 102104 / 103106 / 10496/95
Scope 3 Emissions (Metric Tons CO2e)Fiscal 2022
Fiscal 2023Fiscal 2024Fiscal 2025Fiscal 2026
Scope 3 GHG Emissions by Type     
Category 1 - Purchased goods and services 1,549,501++++++1,203,197
Category 2 - Capital Goods70,718++++++108,354
Category 3 - Fuel and Energy Related Activities25,935++++++22,911
Category 5 - Waste Generated in Operations6,98510++++++6,171
Category 6 - Business Travel1,653++++++3,586
Category 7 - Employee Commuting5,7459++++++6,561
Category 9 - Downstream Transportation and Distribution217,259++++++152,976
Category 12 - End of Life Treatment of Sold Products7,71110++++++6,812
Total Scope 3 GHG Emissions 1,885,517++++++1,510,568
Energy Usage11  
Energy Consumption
Unit of MeasureFiscal 202212Fiscal 202312Fiscal 2024Fiscal 2025Fiscal 2026
Purchased Electricity13
Gigajoules (GJ)1,653,8381,582,1871,488,709
1,501,5441,422,532
Purchased Natural Gas GJ129,691127,594110,188124,224141,193
Total Energy ConsumptionGJ1,783,5291,709,7811,598,8971,625,7681,563,725
ADS Sales$, in millions$2,769$3,071$2,874$2,904$3,050
Energy IntensityGJ per million revenue $644557556560513
Fleet Metrics  
Fleet Efficiency14
Unit of MeasureFiscal 2022Fiscal 2023
Fiscal 2024Fiscal 2025Fiscal 2026
Fuel Economy15Miles per gallon (MPG)6.56.56.46.36.5
Payload Efficiency16Pounds shipped per miles traveled
23.722.022.222.520.8
Fuel Consumed17GJ1,016,622920,720854,618882,470830,630
NOx emissions18Grams per mile (g/m)

Grams per ton mile (g/tm)
3.25 [4.65]

0.26 [0.26]
3.02 [4.03]

0.29 [0.29]
2.99 [3.99]

0.30 [0.30]

2.92 [2.92]

0.26 [0.29]

2.73 [2.47]

0.80 [0.36]
CO2 emissions18Grams per mile (g/m)

Grams per ton mile (g/tm)
1,610 [1,510]

107 [107]
1,601 [1,491]

105 [105]
1,558 [1,558]

117 [117]
1,590 [1,457]

90 [121]
1,585 [1,317]

468 [189.5]
Particulate matter emission18Grams per mile (g/m)

Grams per ton mile (g/tm)
0.0445 [0.0445]

0.0028 [0.0028]
0.0052 [0.0332]

0.0017 [0.0028]
0.0051 [0.0321]

0.0018 [0.003]

0.0056 [0.141]

0.0013 [0.0031]

0.0720 [0.0624]

0.0212 [0.0090]
Remanufactured Product Revenue19  
Remanufactured Product Revenue Unit of MeasureFiscal 2022Fiscal 2023Fiscal 2024Fiscal 2025Fiscal 2026
Remanufactured Product Revenue% of total revenue57.2%52.6%51.1%49.4%46.8%
Percent of revenue from remanufactured products% of total pipe revenue60.8%56.7%53.7%50.2%47.7%
Waste  
Waste Generated (metric tons)Fiscal 2023Fiscal 2024Fiscal 2025Fiscal 2026
Total hazardous waste generated21454535
Total non-hazardous waste generated77,59073,985 69,51870,472
Total waste generated77,63574,03069,52170,472
Ratio: Hazardous waste / Revenue (metric tons/million revenue $)0.010.02 0.0010.002
Ratio: Non-hazardous waste / Revenue (metric tons/million revenue $)25.2625.7423.9423.11
Waste Disposal (metric tons)Fiscal 2023Fiscal 2024Fiscal 2025Fiscal 2026
Non-hazardous waste to landfill26,11827,97824,59016,582
Non-hazardous waste recycled externally26,60925,77924,73223,832
Non-hazardous waste recycled internally 24,86220,22820,19630,857
Total non-hazardous waste generated 77,58973,98569,51870,472
Ratio: Non-hazardous waste to landfill/Revenue (metric tons/million revenue $)8.509.738.475.44
Ratio: Non-hazardous waste to diverted from landfill/Revenue (metric tons/million revenue $)16.7616.0115.4717.67
Employee Health & Safety44,45  
 Fiscal 2022Fiscal 2023Fiscal 2024Fiscal 2025Fiscal 2026
Total Recordable Injury Rate462.72.6 2.11.961.52
Fatality Rate0.000.020.000.000.00
Near Miss Frequency Rate479.59.411.719.6820.07

Water Consumption Data  
Water Consumption (Megaliters)Fiscal 2022Fiscal 2023Fiscal 202422Fiscal 2025Fiscal 2026
Total Water Intake23517493482459354

6. Fiscal 2026 and prior exclude NDS sites (acquired in February 2026). Fiscal 2025 and prior exclude Orenco sites (acquired in October 2024). The data does not include joint ventures facilities in Mexico or Other International, which represent less than 5% of net sales.
7. Fiscal 2022 and Fiscal 2023 Scope 1 & 2 emissions and totals reported in this table have been updated to match the calculations and reporting transparency methods used in Fiscal 2024.
8. The methodology for calculating Scope 1 GHG emissions for Fiscal 2024 includes CH4 , and N2 O emissions in addition to CO2 emissions previously reported (the sum of CH4 , N2 O and CO2 comprises CO2 e). Scope 1 Emissions for Fiscal 2022 and 2023 were also updated to use this same methodology.
9. Estimated using ratio of number of employees in FY22 vs. FY26.
10. Estimated using ratio of pipe production lbs FY22 vs. FY26
11. FY2026 data does not include NDS (acquired in February 2026). Fiscal 2025, Fiscal 2024, Fiscal 2023 and Fiscal 2022 data does not include Orenco (acquired in October 2024) the joint ventures in Mexico or other international sales which represent less than 5% of net sales. Fiscal 2024, Fiscal 2023 and Fiscal 2022 data does not include Cultec (acquired in May 2022). In addition, Fiscal 2023 and Fiscal 2022 data does not include Jet Polymers (acquired in December 2021).
12. In Fiscal 2024, ADS refined our data collection, calculation and reporting process and re-stated figures for Fiscal 2022 and Fiscal 2023 to ensure accuracy of methodology across all reporting year data. The re-stated figures are included in this table.
13. 100% grid electricity. We did not intentionally purchase any renewable energy in Fiscal 2026, 2025, 2024, 2023 or 2022.
14. Fleet efficiency data is representative of the entire ADS fleet, which operates in the United States and Canada.
15. MPG is defined as total miles traveled divided by total fuel consumed. MPG is tracked through a third-party telematics program. Telematics are installed on all ADS medium and heavy-duty ADS trucks.
16. ADS defines payload efficiency as the total pounds shipped on ADS fleet divided by the total miles traveled on the ADS fleet. ADS uses payload efficiency as a measure of capacity utilization.
17. Fuel is tracked through a third-party telematics program. Converted from gallons to GJ at a rate of 0.14652 GJ per 1 gallon. Dyed-diesel usage for onsite mobile equipment is not included in this number. However emissions from the use of dyed-diesel for onsite mobile equipment are included in the Fiscal 2025 and Fiscal 2026 GHG emissions estimates provided in this report.
18. As part of our commitment to the SmartWay Program, NOx, CO2 and Particulate Matter emissions are tracked on a calendar year basis. Values for Fiscal 2026, represent calendar year 2025 data, Fiscal 2025, represent calendar year 2024 data, Fiscal 2024 values represent calendar 2023 data, Fiscal 2023 values represent calendar 2022 data, Fiscal 2022 values represent calendar 2021 data. Data in brackets represents data for the ADS fleet in Canada, which is tracked and reported to the US EPA SmartWay Program separately.
19. Prior year numbers have been restated to reflect percentage of total revenue.
21. Fiscal 2026 and 2025 Hazardous Waste data was collected from hazardous wastes manifests for all manufacturing facilities. For Fiscal 2023 and 2024 hazardous waste data is an estimate based on manifests collected at the facilities in Fiscal 2023 and estimated based on the weight of water.
22. Data for Fiscal Year 2024 was revised to reflect an overstatement due to an error in tracking for a newly added site, the adjustment for which was made during Fiscal Year 2025.
23. Water intake data is not yet available for the following: Joint Ventures in Mexico and South America, domestic facilities that utilize well water, and offices or distribution centers where water is included in the lease.
27. Safety statistics are representative of the ADS Legacy operations in the United States and Canada and Infiltrator. Jet Polymers and Cultec data is included starting in Fiscal 2023. The data does not include joint ventures in Mexico or Other International, which represent less than 5% of net sales.
28. Rates are calculated as: (Statistic count x 200,000) / hours worked
29. TRIR: A work-related injury or illness is considered a recordable incident if it results in any of the following: death, days away from work, restricted work or transfer to another job, medical treatment beyond first aid, or loss of consciousness. Additionally, a significant injury or illness diagnosed by a physician or other licensed health care professional is considered a recordable incident, even if it does not result in death, days away from work, restricted work or job transfer, medical treatment beyond first aid, or loss of consciousness.
30. Near Miss Frequency Rate: A work-related near miss is defined as an unplanned incident in which no property or environmental damage or personal injury occurred, but where damage or personal injury easily could have occurred but for a slight circumstantial shift.


* Items denoted with an asterisk (*) have received limited assurance

++ data pending recalculation due to change in methodology

 

SASB and GRI Indexes

The ADS Sustainability Report reflects guidance from the Sustainability Accounting Standards Board (SASB) and the Global Reporting Initiative (GRI), relevant third-party sustainability reporting frameworks.

SASB standards are designed to identify and standardize disclosure for the sustainability issues most relevant to investor decision-making, and GRI standards remain the most widely used sustainability reporting standards globally.